Mohr Circle Plotter documentation
This is the documentation for the Mohr Circle Plotter Python package, which provides tools for plotting basic Mohr’s circle visualizations.
License
This software is provided for educational and research purposes only. Results produced by this package should not be used as the sole basis for engineering design decisions without independent verification by a qualified professional engineer.
THE AUTHORS AND CONTRIBUTORS ACCEPT NO LIABILITY for any damages, losses, or consequences arising from the use or misuse of this software. See LICENSE file for full terms (MIT License).
Quickstart
This quickstart guide will help you get up and running with the Mohr Circle Plotter package. For more detailed information, please refer to the modules section.
Installation
To install the Mohr Circle Plotter package, you can use pip:
pip install mohrcircleplotter
Basic Usage
Here’s a simple example to create a Mohr’s circle plot:
from mohrcircleplotter import MohrPlot

# Create a plotter instance which contains a matplotlib figure and axis
plot = MohrPlot(halfplot=True,show_tension=True, units='MPa')

# Define some circles (sigma_x, sigma_y, tau_xy)
circles = [
    (80, 30, 30),
    (60, 20, 20),
    (40, 10, 10)
]

# Plot the circles with red dashed lines showing the orientation of sigma_x
for sigma_x, sigma_y, tau_xy in circles:
    plot.oriented_circle(sigma_x, sigma_y, tau_xy)
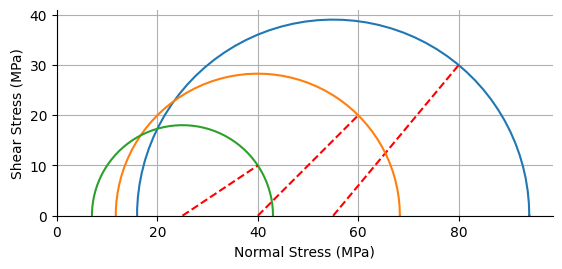
This code will create a Mohr’s circle plot with three circles corresponding to the specified stress states. The red dashed lines indicate the orientation of the \(\sigma_x\) plane for each circle.
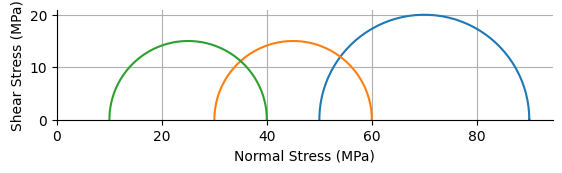
Principal stresses can be input to the plotter using the principal_stress_circle method, which will automatically compute the corresponding circles and orientations.
from mohrcircleplotter import MohrPlot

plot = MohrPlot(halfplot=True,show_tension=True, units='MPa')

# Define principal stresses (sigma_1, sigma_2)
principal_stresses = [
    (90, 50),
    (60, 30),
    (40, 10)
]

# Plot circles from principal stresses
for sigma_1, sigma_2 in principal_stresses:
    plot.principal_stress_circle(sigma_1, sigma_2)
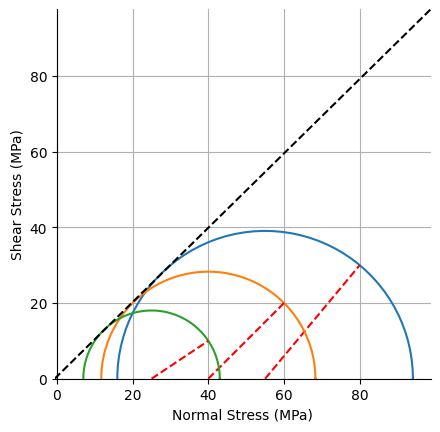
A Mohr-Coulomb failure envelope can be estimated from the plotted circles using the estimated_mc_envelope method, which will fit a line to the points of maximum shear stress and normal stress.
from mohrcircleplotter import MohrPlot

plot = MohrPlot(halfplot=True,show_tension=True, units='MPa')

# Define some circles (sigma_x, sigma_y, tau_xy)
circles = [
    (80, 30, 30),
    (60, 20, 20),
    (40, 10, 10)
]

for sigma_x, sigma_y, tau_xy in circles:
    plot.oriented_circle(sigma_x, sigma_y, tau_xy)

# Estimate and plot the Mohr-Coulomb failure envelope
plot.estimated_mc_envelope()
Usage with matplotlib.pyplot
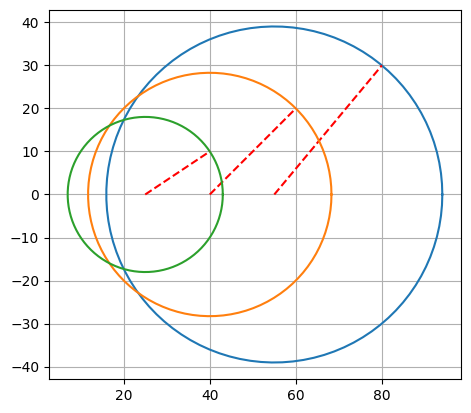
The plotting functions in this package are designed to work with Matplotlib’s pyplot interface. If you want to use the plotting functions without creating a MohrPlot instance, you can do so by passing the current axes to the plotting functions, or by simply calling the function after plt.figure.
import matplotlib.pyplot as plt
from mohrcircleplotter import oriented_circle

# Create a new figure and axis
fig, ax = plt.subplots()

# Define some circles (sigma_x, sigma_y, tau_xy)
circles = [
    (80, 30, 30),
    (60, 20, 20),
    (40, 10, 10)
]

# Plot the circles on the current axis
for sigma_x, sigma_y, tau_xy in circles:
    oriented_circle(sigma_x, sigma_y, tau_xy, ax=ax)

plt.gca().set_aspect('equal', adjustable='box')
plt.grid()
Contents: